profiler
提示
使用async-profiler生成火焰图
profiler 命令支持生成应用热点的火焰图。本质上是通过不断的采样,然后把收集到的采样结果生成火焰图。
profiler 命令基本运行结构是 profiler action [actionArg]
profiler 命令的格式基本与上游项目 async-profiler 保持一致,详细的使用方式可参考上游项目的 README、Github Disscussions 以及其他文档资料。
参数说明
| 参数名称 | 参数说明 |
|---|---|
| action | 要执行的操作 |
| actionArg | 属性名模式 |
| [i:] | 采样间隔(单位:ns)(默认值:10'000'000,即 10 ms) |
| [f:] | 将输出转储到指定路径 |
| [d:] | 运行评测指定秒 |
| [e:] | 要跟踪哪个事件(cpu, alloc, lock, cache-misses 等),默认是 cpu |
启动 profiler
$ profiler start
Started [cpu] profiling
提示
默认情况下,生成的是 cpu 的火焰图,即 event 为cpu。可以用--event参数指定其他性能分析模式,见下文。
获取已采集的 sample 的数量
$ profiler getSamples
23
查看 profiling 状态
$ profiler status
[cpu] profiling is running for 4 seconds
可以查看当前 profiler 在采样哪种event和采样时间。
查看 profiler 自身的内存占用
$ profiler meminfo
Call trace storage:   10244 KB
      Dictionaries:      72 KB
        Code cache:   12890 KB
------------------------------
             Total:   23206 KB
停止 profiler
生成火焰图格式结果
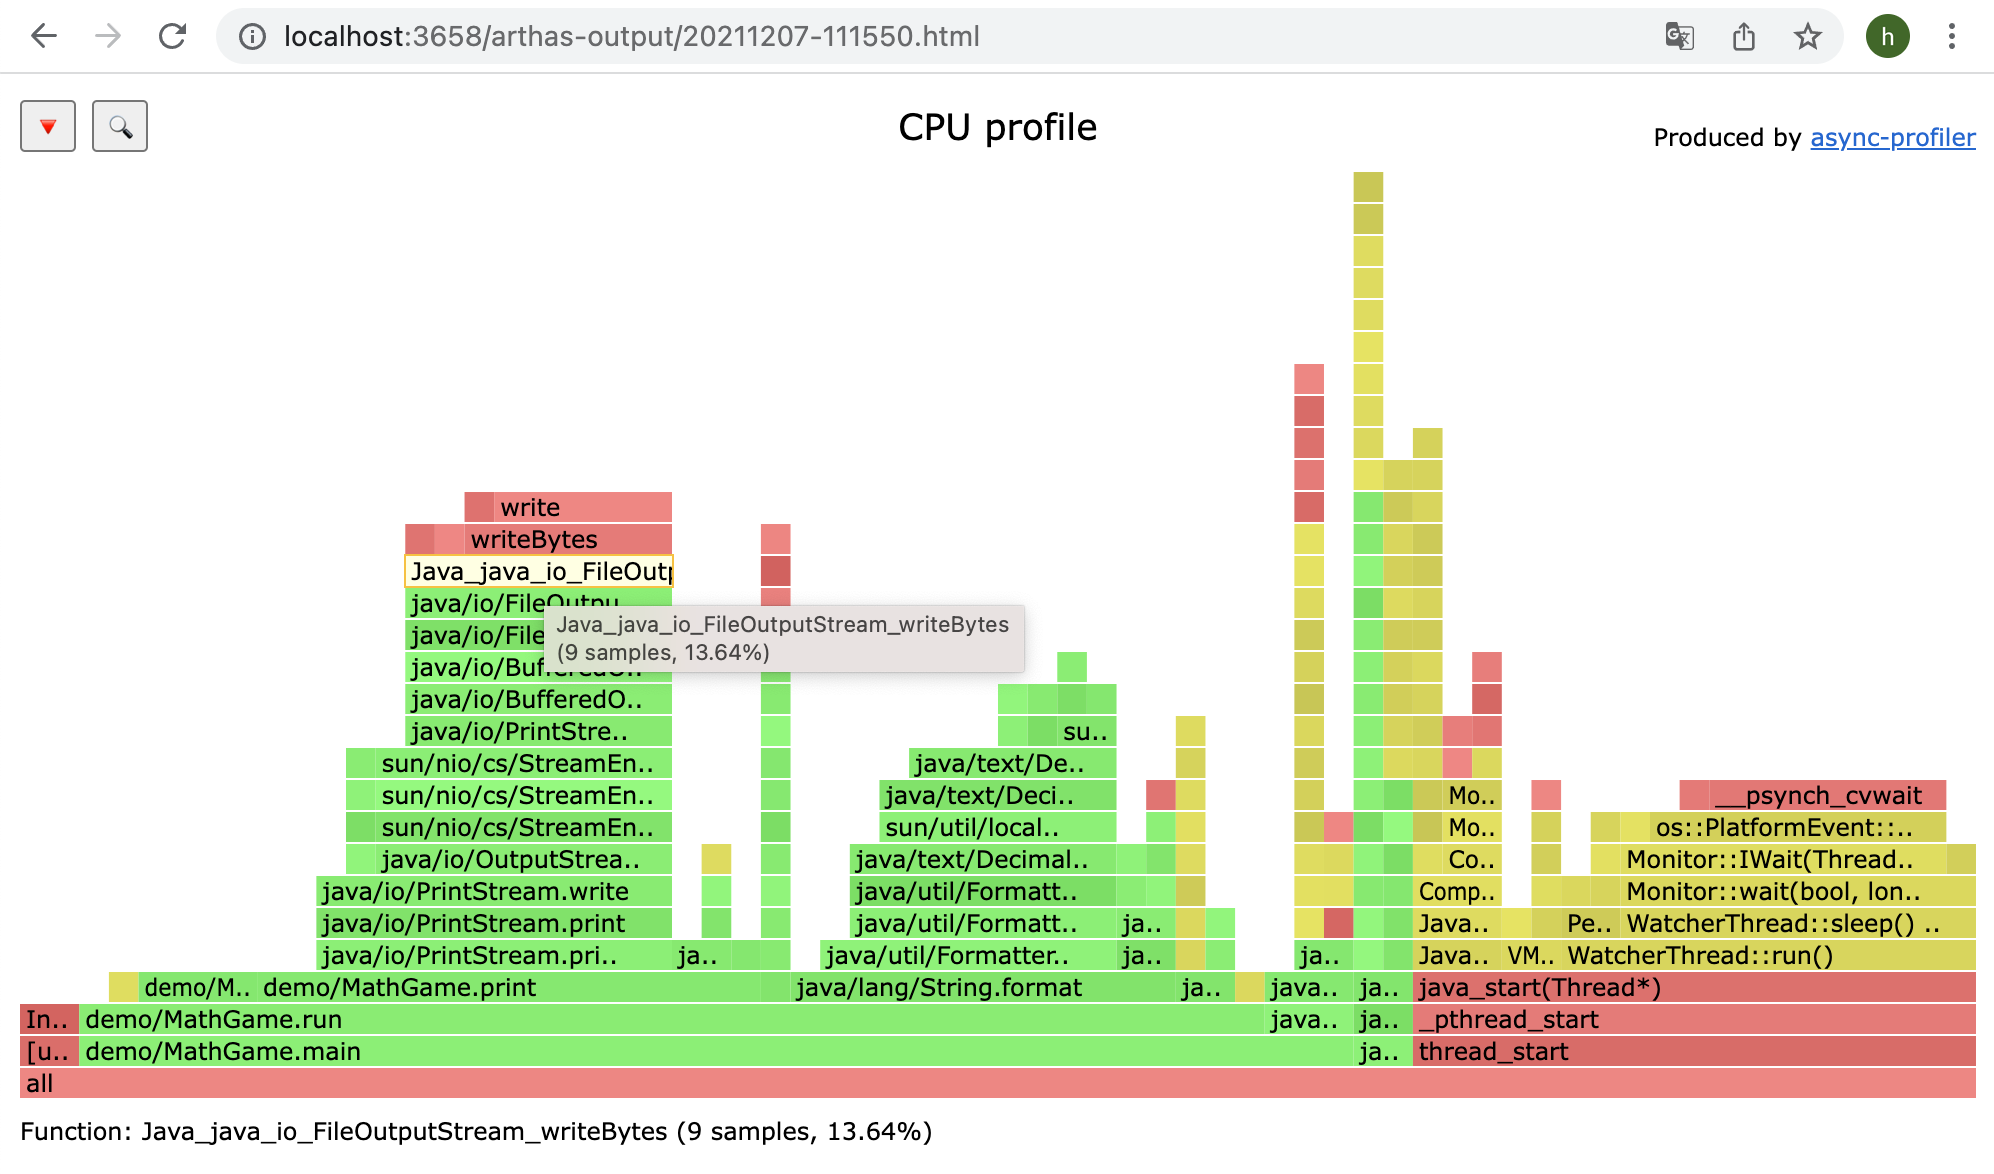
默认情况下,结果是 Flame Graph 格式的 html 文件,也可以用 -o 或 --format 参数指定其他内容格式,包括 flat、traces、collapsed、flamegraph、tree、jfr。
$ profiler stop --format flamegraph
profiler output file: /tmp/test/arthas-output/20211207-111550.html
OK
在--file参数指定的文件名后缀为 html 或 jfr 时,文件格式可以被推断出来。比如--file /tmp/result.html 将自动生成火焰图。
通过浏览器查看 arthas-output 下面的 profiler 结果
默认情况下,arthas 使用 3658 端口,则可以打开: http://localhost:3658/arthas-output/ 查看到arthas-output目录下面的 profiler 结果:
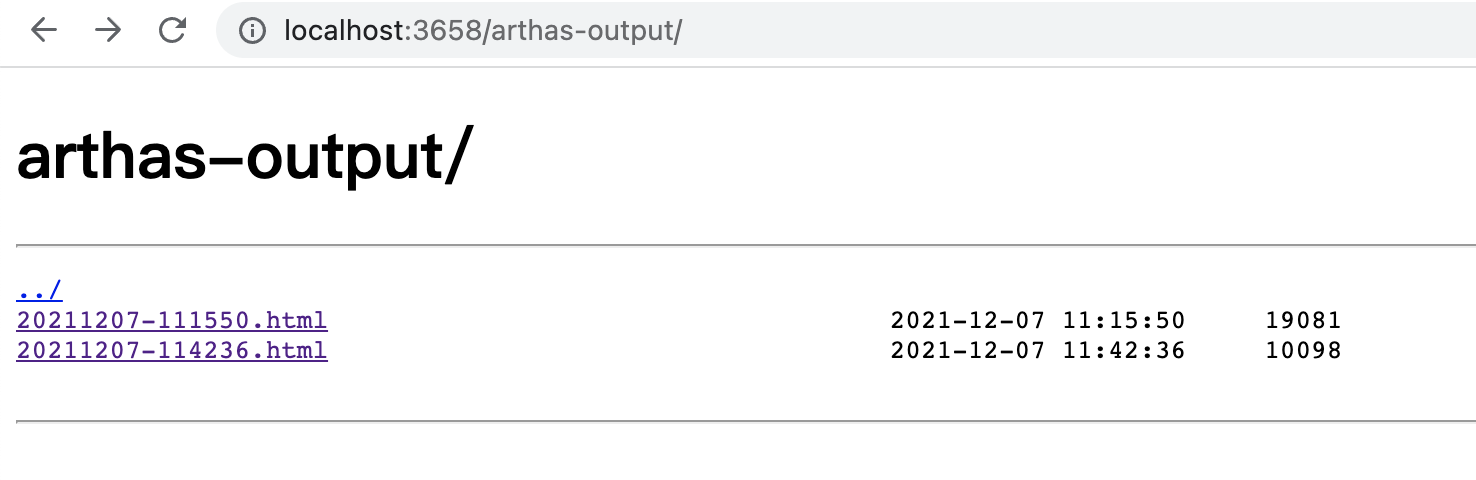
点击可以查看具体的结果:
提示
如果是 chrome 浏览器,可能需要多次刷新。
profiler 支持的 events
在不同的平台,不同的 OS 下面,支持的 events 各有不同。比如在 macos 下面:
$ profiler list
Basic events:
  cpu
  alloc
  lock
  wall
  itimer
  ctimer
在 linux 下面
$ profiler list
Basic events:
  cpu
  alloc
  lock
  wall
  itimer
  ctimer
Java method calls:
  ClassName.methodName
Perf events:
  page-faults
  context-switches
  cycles
  instructions
  cache-references
  cache-misses
  branch-instructions
  branch-misses
  bus-cycles
  L1-dcache-load-misses
  LLC-load-misses
  dTLB-load-misses
  rNNN
  pmu/event-descriptor/
  mem:breakpoint
  trace:tracepoint
  kprobe:func
  uprobe:path
如果遇到 OS 本身的权限/配置问题,然后缺少部分 event,可以参考 async-profiler 的文档。
可以使用 check action 测试某个 event 是否可用,此 action 的参数格式与 start 一致。
可以用--event参数指定要采样的事件,比如 alloc 表示分析内存分配情况:
$ profiler start --event alloc
恢复采样
$ profiler resume
Started [cpu] profiling
start和resume的区别是:start会清除已有的分析结果重新开始,resume则会保留已有的结果,将新的分析结果附加到已有结果中。
通过执行profiler getSamples可以查看 samples 的数量来验证。
Dump 分析结果
$ profiler dump
OK
dump action 将性能分析的结果保存到默认文件或指定的文件中,但 profiling 过程不会停止。例如,如果使用 start action 启动 profiling,5 秒后执行 dump action,2 秒后再次执行 dump action,将会得到 2 个结果文件,第一个文件包括 0~5 秒的分析结果,第二个文件包括 0~7 秒的分析结果。
使用execute来执行复杂的命令
比如开始采样:
profiler execute 'start,framebuf=5000000'
停止采样,并保存到指定文件里:
profiler execute 'stop,file=/tmp/result.html'
具体的格式参考: arguments.cpp
查看所有支持的 action
$ profiler actions
Supported Actions: [resume, dumpCollapsed, getSamples, start, list, version, execute, meminfo, stop, load, dumpFlat, dump, actions, dumpTraces, status, check]
查看版本
$ profiler version
Async-profiler 2.9 built on May  8 2023
Copyright 2016-2021 Andrei Pangin
配置 Java 栈深度
可以使用 -j 或 --jstackdepth 选项指定最大 Java 栈深度。如果指定值大于默认值 2048,该选项会被忽略。当你不希望看到特别深的栈轨迹的时候,这个选项会很有用,以下是一个使用样例:
profiler start -j 256
各线程分别进行 profiling
可以使用 -t 或 --threads 标志选项令 profiling 对各线程分别进行,每个栈轨迹都会以指示单个线程的帧结束。
profiler start -t
配置 include/exclude 来过滤数据
如果应用比较复杂,生成的内容很多,想只关注部分 stack traces,可以通过 --include/--exclude 过滤 stack traces,--include 表示定义的匹配表达式必须出现在 stack traces,相反 --exclude 表示定义的匹配表达式一定不会出现在 stack traces。 匹配表达式可以以*开始或者结束,* 表示任何(可能为空)字符序列。 比如
profiler stop --include 'java/*' --include 'com/demo/*' --exclude '*Unsafe.park*'
--include/--exclude都支持多次设置,但是需要配置在命令行的最后。也可使用短参数格式-I/-X。 注意--include/--exclude只支持在stopaction或者带有-d/--duration参数的startaction中指定,否则不生效。
指定执行时间
比如,希望 profiler 执行 300 秒自动结束,可以用 -d/--duration 参数为 start action 指定时间:
profiler start --duration 300
生成 jfr 格式结果
注意,jfr 只支持在
start时配置。如果是在stop时指定,则不会生效。
profiler start --file /tmp/test.jfr
profiler start -o jfr
file参数支持一些变量:
- 时间戳:
--file /tmp/test-%t.jfr - 进程 ID:
--file /tmp/test-%p.jfr
生成的结果可以用支持 jfr 格式的工具来查看。比如:
- JDK Mission Control : https://github.com/openjdk/jmc
- JProfiler : https://github.com/alibaba/arthas/issues/1416
控制分析结果的格式
使用 -s 选项将结果中的 Fully qualified name 替换为简单名称,如 demo.MathGame.main 替换为 MathGame.main。使用 -g 选项指定输出方法签名,如 demo.MathGame.main 替换为 demo.MathGame.main([Ljava/lang/String;)V。此外还有许多可调整分析结果格式的选项,可参考 async-profiler 的 README 文档 以及 async-profiler 的 Github Discussions 等材料。
例如,以下命令中,-s 将输出中的类名称指定为简短格式,-g 显示方法的完整签名,-a 标注出 Java 方法,-l 为原生方法增加库名称,--title 为生成火焰图页面指定标题,--minwidth 将过滤火焰图中宽度为 15% 以下的帧,--reverse 将火焰图倒置。
profiler stop -s -g -a -l --title <flametitle> --minwidth 15 --reverse
生成的火焰图里的 unknown
- https://github.com/jvm-profiling-tools/async-profiler/discussions/409
配置 locks/allocations 模式的阈值
当使用 lock 或 alloc event 进行 profiling 时,可以使用 --lock 或 --alloc 配置阈值,比如下列命令:
profiler start -e lock --lock 10ms
profiler start -e alloc --alloc 2m
会记录竞争时间超过 10ms 的锁(如果不指定时间单位,则使用 ns 为单位),或者以 2MB 的单位记录对内存的分配。
配置 JFR 块
当使用 JFR 作为输出格式时,可以使用 --chunksize 或 --chunktime 配置单个 JFR 块的大致容量(以 byte 为单位,默认 100 MB)和时间限制(默认值为 1 小时),比如:
profiler start -f profile.jfr --chunksize 100m --chunktime 1h
将线程按照调度策略分组
可以使用 --sched 标志选项将输出结果按照 Linux 线程调度策略分组,策略包括 BATCH/IDLE/OTHER。例如:
profiler start --sched
火焰图的倒数第二行会标记不同的调度策略。
仅用未销毁对象构建内存分析结果
使用 --live 标志选项在内存分析结果中仅保留那些在分析过程结束时仍未被 JVM 回收的对象。该选项在排查 Java 堆内存泄露问题时比较有用。
profiler start --live
配置收集 C 栈帧的方法
使用 --cstack MODE 配置收集 native 帧的方法。候选模式有 fp (Frame Pointer), dwarf (DWARF unwind info), lbr (Last Branch Record, 从 Linux 4.1 在 Haswell 可用), and no (不收集 native 栈帧).
默认情况下,C 栈帧会出现在 cpu、itimer、wall-clock、perf-events 模式中,而 Java 级别的 event 比如 alloc 和 lock 只收集 Java stack。
profiler --cstack fp
此命令将收集 native 栈帧的 Frame Pointer 信息。
当指定 Native 函数执行时开始/停止 Profiling
使用 --begin function 和 --end function 选项,可以在指定的 Native 函数被执行时启动或终止性能分析。主要用途是分析特定的 JVM 阶段,比如 GC 和 Safepoint。需要使用特定 JVM 实现中的 Native 函数名,比如在 HotSpot JVM 中的 SafepointSynchronize::begin 和 SafepointSynchronize::end。
Time-to-Safepoint Profiling
选项 --ttsp 实际上是 --begin SafepointSynchronize::begin --end RuntimeService::record_safepoint_synchronized 的一个别名。它是一种约束,而不是独立的事件类型。无论选择哪种事件,Profiler 都可以正常工作,但只有在 VM 操作和 Safepoint 请求之间的事件会被记录下来。
现在,当使用 --ttsp 选项并指定 JFR 输出格式时,profiler 会在生成的 JFR 文件中自动包含 profiler.Window 事件。这些事件表示每次 Time-to-Safepoint 暂停的时间区间,使您无需依赖 JVM 日志即可分析这些暂停。
示例
profiler start --begin SafepointSynchronize::begin --end RuntimeService::record_safepoint_synchronized
profiler start --ttsp --format jfr
生成的 JFR 文件将包含 profiler.Window 事件,可以使用 JDK Mission Control 等工具查看和分析这些事件。
注意事项:
profiler.Window 事件是通用的事件,适用于任何使用 --begin 和 --end 触发器的时间窗口,不仅限于 Safepoint 暂停。
在分析长时间的 Safepoint 暂停时,profiler.Window 事件可帮助您识别造成延迟的原因。
当使用 --ttsp 选项时,请确保使用 JFR 输出格式,以便能够生成并查看 profiler.Window 事件。
使用 profiler 记录的 event 生成 JFR 文件
用 --jfrsync CONFIG 选项可以指定配置启动 Java Flight Recording,输出的 jfr 文件会包含所有常规的 JFR event,但采样的来源是由 profiler 提供的。
CONFIG 参数:
- 预置配置:CONFIG 可以是 profile,表示使用 $JAVA_HOME/lib/jfr 目录下预置的 profile 配置。
- 自定义配置文件:CONFIG 也可以是自定义的 JFR 配置文件(.jfc),此选项的值采用与 jcmd JFR.start 命令的 settings 选项相同的格式。
- 指定 JFR 事件列表:现在,可以直接在 --jfrsync 中指定要启用的 JFR 事件列表,而无需创建 .jfc 文件。要指定事件列表,请以 + 开头,多个事件用 + 分隔。
示例:
使用预置的 profile 配置启动 JFR:
profiler start -e cpu --jfrsync profile -f combined.jfr
直接指定 JFR 事件列表,例如启用 jdk.YoungGarbageCollection 和 jdk.OldGarbageCollection 事件:
profiler start -e cpu --jfrsync +jdk.YoungGarbageCollection+jdk.OldGarbageCollection -f combined.jfr
注意事项
- 当指定事件列表时,由于逗号 , 用于分隔不同的选项,因此事件之间使用加号 + 分隔。
- 如果 --jfrsync 参数不以 + 开头,则被视为预置配置名或 .jfc 配置文件的路径。
- 直接指定事件列表在目标应用运行在容器中时特别有用,无需额外的文件操作。
周期性保存结果
使用 --loop TIME 可以持续运行 profiler 并周期性保存结果。选项格式可以是具体时间 hh:mm:ss 或以秒、分钟、小时或天计算的时间间隔。需要确保指定的输出文件名中包含时间戳,否则每次输出的结果都会覆盖上次保存的结果。以下命令持续执行 profiling 并将每个小时内的记录保存到一个 jfr 文件中。
如果没有指定
-f参数,则不会保存任何内容。如果-f参数里没有%t,则会循环保存到同一个文件里。
profiler start --loop 1h -f /var/log/profile-%t.jfr
--timeout 选项
profiler start --timeout 300s
这个选项指定 profiling 自动在多久后停止。该选项和 --loop 选项的格式一致,可以是时间点,也可以是一个时间间隔。这两个选项都是用于 start action。可参考 async-profiler docs 了解更多信息。
--wall 选项
通过 --wall 选项,可以同时进行 CPU 和 Wall Clock 的性能分析。
- 这种联合分析有助于更全面地识别和理解应用程序的性能瓶颈。
- 允许用户独立于 CPU 分析设置 Wall Clock 分析的采样间隔。比如,可以通过设置 -e cpu -i 10 --wall 200,将 CPU 采样间隔设为 10 毫秒,墙钟采样间隔设为 200 毫秒。
- 联合进行 CPU 和 Wall Clock 分析时,输出格式必须设置为 jfr。这一格式支持记录线程的状态信息(如 STATE_RUNNABLE 或 STATE_SLEEPING),从而区分不同类型的采样事件。
可参考 async-profiler Github pr#740 了解更多信息。
影响:
Linux 平台: 这个新功能仅在 Linux 平台上有效。macOS 上的 CPU 分析引擎已经基于 Wall clock 模式,因此没有额外的收益。 性能开销: 启用 Wall clock 分析会增加性能开销,因此在同时分析 CPU 和 Wall clock 时,建议增加 Wall clock 的间隔。
profiler start -e cpu -i 10 --wall 100 -f out.jfr
ctimer事件
ctimer 事件是一种新的 CPU 采样模式,基于 timer_create,提供了无需 perf_events 的精确 CPU 采样。
在某些情况下,perf_events 可能不可用,例如由于 perf_event_paranoid 设置或 seccomp 限制,或者在容器环境中。虽然 itimer 事件可以在容器中工作,但可能存在采样不准确的问题。
ctimer 事件结合了 cpu 和 itimer 的优点:
- 高准确性:提供精确的 CPU 采样。
- 容器友好:默认在容器中可用。
- 低资源消耗:不消耗文件描述符。
请注意,ctimer 事件目前仅在 Linux 上支持,不支持 macOS。 可参考 async-profiler Github Issues 了解更多信息。
示例:
profiler start -e ctimer -o jfr -f ./out-test.jfr
vtable特性
在某些应用程序中,大量的 CPU 时间花费在调用 megamorphic 的虚方法或接口方法上,这在性能分析中显示为 vtable stub 或 itable stub。这无法帮助我们了解特定调用点为何是megamorphic 以及如何优化它。
vtable 特性可以在 vtable stub 或 itable stub 之上添加一个伪帧,显示实际调用的对象类型。这有助于清楚地了解在特定调用点,不同接收者的比例。
该特性默认禁用,可以通过 -F vtable 选项启用(或使用 features=vtable)。 可参考 async-profiler Github Issues 了解更多信息。
示例:
profiler start -F vtable
comptask 特性
profiler 采样 JIT 编译器线程以及 Java 线程,可以显示 JIT 编译所消耗的 CPU 百分比。然而,Java 方法的编译资源消耗各不相同,了解哪些特定的 Java 方法在编译时消耗最多的 CPU 时间非常有用。
comptask 特性可以在 C1/C2 的堆栈跟踪中添加一个虚拟帧,显示当前正在编译的任务,即正在编译的 Java 方法。
该特性默认禁用,可以通过 -F comptask 选项启用(或使用 features=comptask)。 可参考 async-profiler Github Issues 了解更多信息。
示例:
profiler start -F comptask
配置替代的分析信号
profiler 使用 POSIX 信号来进行性能分析。默认情况下,SIGPROF 用于 CPU 分析,SIGVTALRM 用于 Wall-Clock 分析。然而,如果应用程序也使用这些信号,或者希望同时运行多个 profiler 实例,这可能会导致信号冲突。
现在,可以使用 signal 参数来配置用于分析的信号,以避免冲突。 可参考 async-profiler Github Issues 了解更多信息。
语法
profiler start --signal <信号号码>
如果需要分别指定 CPU 和 Wall-Clock 分析的信号,可以使用以下语法:
profiler start --signal <CPU信号号码>/<Wall信号号码>
--clock 选项
--clock 选项允许用户控制用于采样时间戳的时钟源。这对于需要将 profiler 的数据与其他工具的数据进行时间戳对齐的场景非常有用。
用法
profiler start --clock <tsc|monotonic>
参数
tsc:使用 CPU 的时间戳计数器(RDTSC)。这是默认选项,提供高精度的时间戳。monotonic:使用操作系统的单调时钟(CLOCK_MONOTONIC)。这有助于在多种数据源之间对齐时间戳。 可参考 async-profiler Github Issues 了解更多信息。
示例 :
使用 CLOCK_MONOTONIC 作为时间戳源:
profiler start --clock monotonic
注意事项:
- 当需要将
profiler的数据与其他使用CLOCK_MONOTONIC的工具(例如perf)的数据进行对齐时,使用--clock monotonic。 - 在使用
jfrsync模式时,请谨慎使用--clock选项,因为 JVM 和profiler可能使用不同的时间戳源,这可能导致结果不一致。
--norm 选项
在 Java 20 及更早的版本中,编译器为 lambda 表达式生成的方法名称包含唯一的数字后缀。例如,同一代码位置定义的 lambda 表达式,可能会生成多个不同的帧名称,因为每个 lambda 方法的名称都会附加一个唯一的数字后缀(如 lambda$method$0、lambda$method$1 等)。这会导致逻辑上相同的堆栈无法在火焰图中合并,增加了性能分析的复杂性。
为了解决这个问题,profiler 新增了 --norm 选项,可以在生成输出时自动规范化方法名称,去除这些数字后缀,使相同的堆栈能够正确地合并。 可参考 async-profiler Github Issues 了解更多信息。
示例:
生成规范化的火焰图:
profiler start --norm