profiler
TIP
Generate a flame graph using async-profiler
The profiler command supports generating flame graph for application hotspots.
The basic usage of the profiler command is profiler action [actionArg]
The arguments of profiler command basically keeps consistent with upstream project async-profiler, you can refer to its README, Github Discussions and other documentations for further information of usage.
Supported Options
| Name | Specification |
|---|---|
| action | Action to execute |
| actionArg | Attribute name pattern |
| [i:] | sampling interval in ns (default: 10'000'000, i.e. 10 ms) |
| [f:] | dump output to specified directory |
| [d:] | run profiling for specified seconds |
| [e:] | which event to trace (cpu, alloc, lock, cache-misses etc.), default value is cpu |
Start profiler
$ profiler start
Started [cpu] profiling
TIP
By default, the sample event is cpu. Other valid profiling modes can be specified with the --event parameter, see relevant contents below.
Get the number of samples collected
$ profiler getSamples
23
View profiling status
$ profiler status
[cpu] profiling is running for 4 seconds
Can view which event and sampling time.
View profiler memory usage
$ profiler meminfo
Call trace storage:   10244 KB
      Dictionaries:      72 KB
        Code cache:   12890 KB
------------------------------
             Total:   23206 KB
Stop profiler
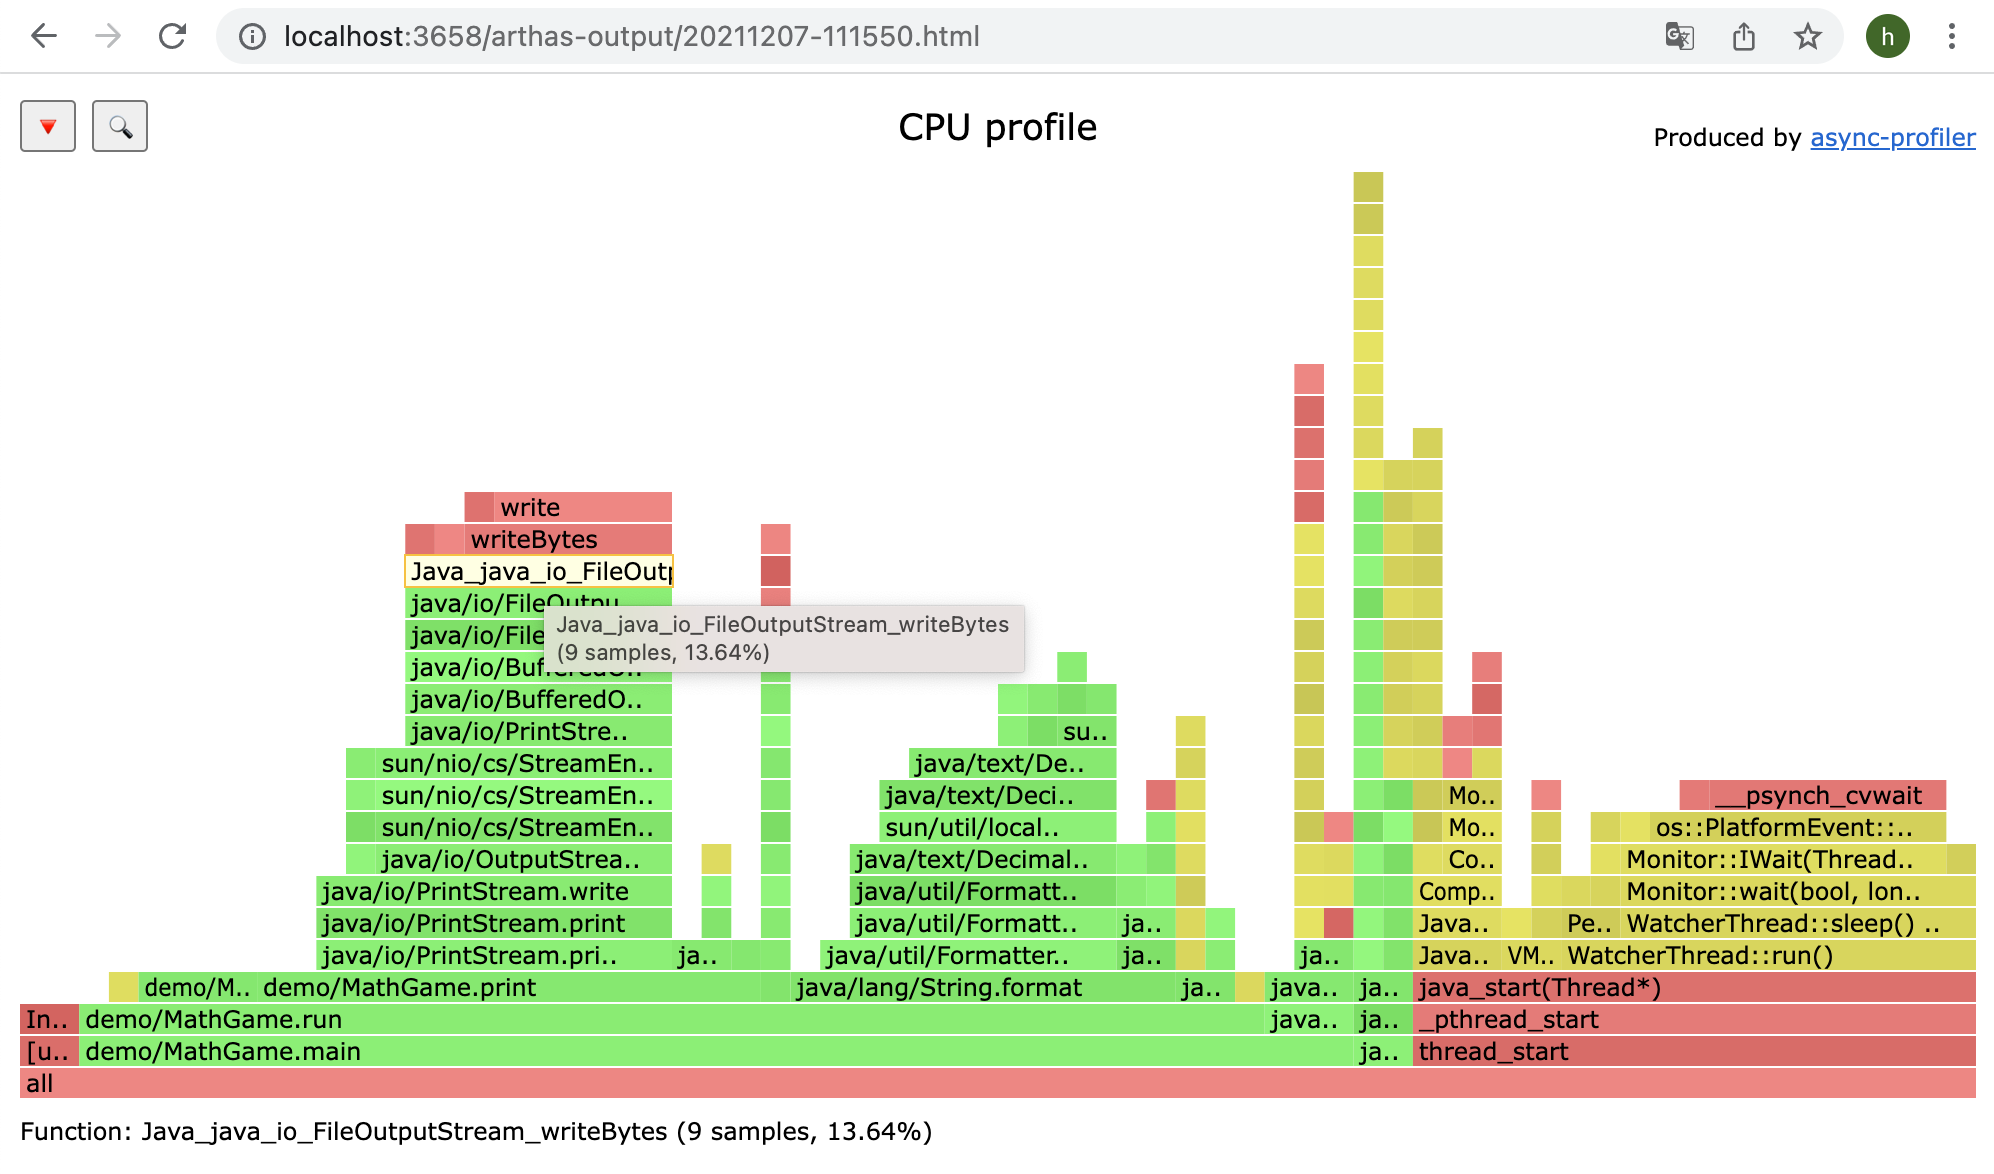
Generating flame graph results
By default, the result file is html file in Flame Graph format. You can also specify other format with the -o or --format parameter, including flat, traces, collapsed, flamegraph, tree, jfr:
$ profiler stop --format flamegraph
profiler output file: /tmp/test/arthas-output/20211207-111550.html
OK
When extension of filename in --file parameter is html or jfr, the output format can be infered. For example, --file /tmp/result.html will generate flamegraph automatically.
View profiler results under arthas-output via browser
By default, arthas uses port 3658, which can be opened: http://localhost:3658/arthas-output/ View the arthas-output directory below Profiler results:
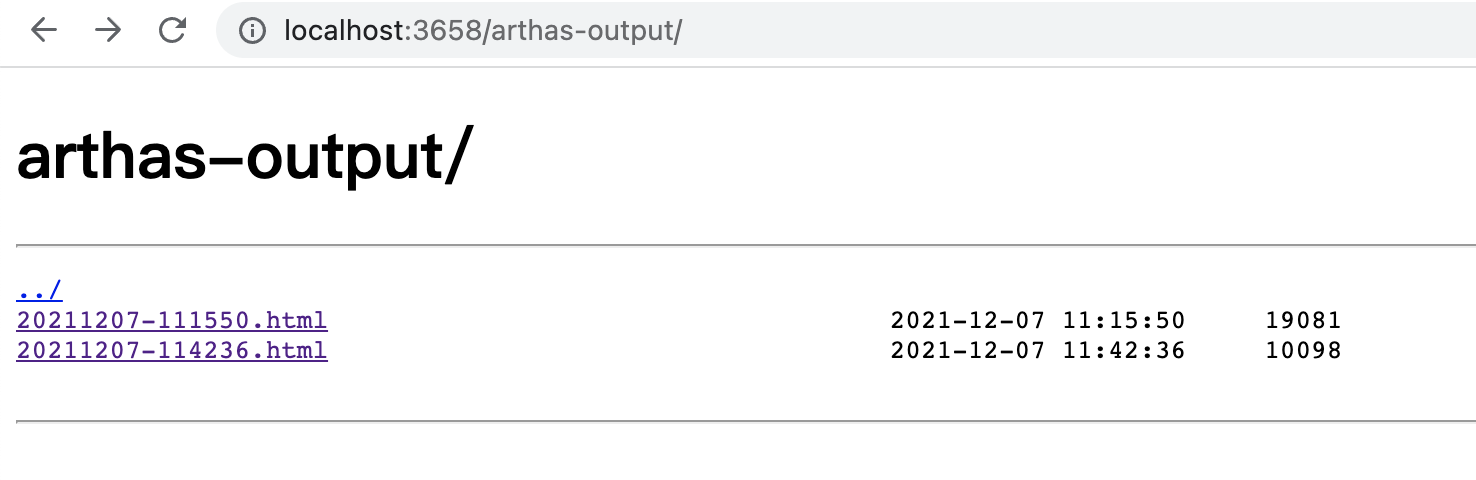
Click to view specific results:
TIP
If using the chrome browser, may need to be refreshed multiple times.
Profiler supported events
Under different platforms and different OSs, the supported events are different. For example, under macos:
$ profiler list
Basic events:
  cpu
  alloc
  lock
  wall
  itimer
  ctimer
Under linux
$ profiler list
Basic events:
  cpu
  alloc
  lock
  wall
  itimer
  ctimer
Java method calls:
  ClassName.methodName
Perf events:
  page-faults
  context-switches
  cycles
  instructions
  cache-references
  cache-misses
  branch-instructions
  branch-misses
  bus-cycles
  L1-dcache-load-misses
  LLC-load-misses
  dTLB-load-misses
  rNNN
  pmu/event-descriptor/
  mem:breakpoint
  trace:tracepoint
  kprobe:func
  uprobe:path
If you encounter the permissions/configuration issues of the OS itself and then missing some events, you can refer to the async-profiler documentation.
You can use check action to check if a profiling event is available, this action receives the same format options with start.
You can use the --event parameter to specify the event to sample, for example, alloc event means heap memory allocation profiling:
$ profiler start --event alloc
Resume sampling
$ profiler resume
Started [cpu] profiling
The difference between start and resume is: start will clean existing result of last profiling before starting, resume will retain the existing result and add result of this time to it.
You can verify the number of samples by executing profiler getSamples.
Dump action
$ profiler dump
OK
The dump action saves profiling result to default file or specified file, but profiling will continue. That means if you start profiling and dump after 5 seconds, then dump after 2 seconds again, you will get 2 result files, the first one contains profiling result of 0~5 seconds and the second one contains that of 0~7 seconds.
Use execute action to execute complex commands
For example, start sampling:
profiler execute 'start,framebuf=5000000'
Stop sampling and save to the specified file:
profiler execute 'stop,file=/tmp/result.html'
Specific format reference: arguments.cpp
View all supported actions
$ profiler actions
Supported Actions: [resume, dumpCollapsed, getSamples, start, list, version, execute, meminfo, stop, load, dumpFlat, dump, actions, dumpTraces, status, check]
View version
$ profiler version
Async-profiler 2.9 built on May  8 2023
Copyright 2016-2021 Andrei Pangin
Configure Java stack depth
You can use -j or --jstackdepth option to configure maximum Java stack depth. This option will be ignored if value is greater than default 2048. This option is useful when you don't want to see stacks that are too deep. Below is usage example:
profiler start -j 256
Profiling different threads separately
You can use -t or --threads flag option to profile different threads separately, each stack trace will end with a frame that denotes a single thread.
profiler start -t
Configure include/exclude to filter data
If the application is complex and generates a lot of content, and you want to focus on only part of stack traces, you can filter stack traces by --include/--exclude. --include defines the name pattern that must be present in the stack traces, while --exclude is the pattern that must not occur in any of stack traces in the output.A pattern may begin or end with a star * that denotes any (possibly empty) sequence of characters. such as
profiler stop --include'java/*' --include 'com/demo/*' --exclude'*Unsafe.park*'
Both
--include/--excludesupport being set multiple times, but need to be configured at the end of the command line. You can also use short parameter format-I/-X. Note that--include/--excludeonly supports configuration atstopaction orstartaction with-d/--durationparameter, otherwise it will not take effect.
Specify execution time
For example, if you want the profiler to automatically end after 300 seconds, you can specify it with the -d/--duration parameter in start action:
profiler start --duration 300
Generate jfr format result
Note that jfr only supports configuration at
start. If it is specified atstop, it will not take effect.
profiler start --file /tmp/test.jfr
profiler start -o jfr
The file parameter supports some variables:
- Timestamp:
--file /tmp/test-%t.jfr - Process ID:
--file /tmp/test-%p.jfr
The generated results can be viewed with tools that support the jfr format. such as:
- JDK Mission Control: https://github.com/openjdk/jmc
- JProfiler: https://github.com/alibaba/arthas/issues/1416
Control details in result
The -s parameter will use simple name instead of Fully qualified name, e.g. MathGame.main instead of demo.MathGame.main. The -g parameter will use method signatures instead of method names, e.g. demo.MathGame.main([Ljava/lang/String;)V instead of demo.MathGame.main. There are many parameters related to result format details, you can refer to async-profiler README and async-profiler Github Discussions and other information.
For example, in command below, -s use simple name for Java class, -g show method signatures, -a will annotate Java methods, -l will prepend library names for native method, --title specify a title for flame graph page, --minwidth will skip frames smaller than 15% in flame graph, --reverse will generate stack-reversed FlameGraph / Call tree.
profiler stop -s -g -a -l --title <flametitle> --minwidth 15 --reverse
The 'unknown' in profiler result
- https://github.com/jvm-profiling-tools/async-profiler/discussions/409
Config locks/allocations profiling threshold
When profiling in locks or allocations event, you can use --lock or --alloc to config thresholds, for example:
profiler start -e lock --lock 10ms
profiler start -e alloc --alloc 2m
will profile contended locks longer than 10ms (default unit is ns if no unit is specified), or profile allocations with 2m BYTES interval.
Config JFR chunks
When using JFR as output format, you can use --chunksize or --chunktime to config approximate size (in bytes, default value is 100MB) and time limits (default value is 1 hour) for a single JFR chunk. For example:
profiler start -f profile.jfr --chunksize 100m --chunktime 1h
Group threads by scheduling policy
You can use --sched flag option to group threads in output by Linux-specific scheduling policy: BATCH/IDLE/OTHER, for example:
profiler start --sched
The second line from bottom in flamegraph represent the scheduling policy.
Build allocation profile from live objects only
Use --live flag option to retain allocation samples with live objects only (object that have not been collected by the end of profiling session). Useful for finding Java heap memory leaks.
profiler start --live
Config method of collecting C stack frames
Use --cstack MODE to config how to walk native frames (C stack). Possible modes are fp (Frame Pointer), dwarf (DWARF unwind info), lbr (Last Branch Record, available on Haswell since Linux 4.1), and no (do not collect C stack).
By default, C stack is shown in cpu, itimer, wall-clock and perf-events profiles. Java-level events like alloc and lock collect only Java stack.
profiler --cstack fp
The command above will collection Frame Pointer of C stacks.
Start/Stop Profiling When a Specified Native Function is Executed
Using the --begin function and --end function options, you can start or stop profiling when a specified native function is executed. The main use is to analyze specific JVM phases, such as GC and Safepoint. You need to use the native function names in the specific JVM implementation, such as SafepointSynchronize::begin and SafepointSynchronize::end in HotSpot JVM.
Time-to-Safepoint Profiling
The option --ttsp is actually an alias for --begin SafepointSynchronize::begin --end RuntimeService::record_safepoint_synchronized. It is a constraint, not a separate event type. The Profiler will work regardless of which event is selected, but only events between VM operations and Safepoint requests will be recorded.
profiler now automatically includes profiler.Window events in the generated JFR file when the --ttsp option is used and a JFR output format is specified. These events represent the time interval of each Time-to-Safepoint pause, allowing you to analyze these pauses without relying on JVM logs.
Example
profiler start --begin SafepointSynchronize::begin --end RuntimeService::record_safepoint_synchronized
profiler start --ttsp --format jfr
The generated JFR file will contain profiler.Window events, which can be viewed and analyzed using tools such as JDK Mission Control.
Notes:
profiler.Window events are generic events that apply to any time window using the --begin and --end triggers, not just Safepoint pauses.
When analyzing long Safepoint pauses, profiler.Window events can help you identify the cause of delays.
When using the --ttsp option, make sure to use the JFR output format so that profiler.Window events can be generated and viewed.
Generate JFR file using events recorded by profiler
Use --jfrsync CONFIG option to specify configuration to start Java Flight Recording. The output jfr file will contain all normal JFR events, but the sampling sources are provided by the profiler.
CONFIG parameters:
Preset configuration: CONFIG can be profile, which means to use the preset profile configuration in the $JAVA_HOME/lib/jfr directory.
Custom configuration file: CONFIG can also be a custom JFR configuration file (.jfc). The value of this option uses the same format as the settings option of the jcmd JFR.start command.
Specify a list of JFR events: Now, you can directly specify the list of JFR events to be enabled in --jfrsync without creating a .jfc file. To specify a list of events, start with + and separate multiple events with +.
Example:
Start JFR with a preset profile configuration:
profiler start -e cpu --jfrsync profile -f combined.jfr
Directly specify a list of JFR events, for example, to enable jdk.YoungGarbageCollection and jdk.OldGarbageCollection events:
profiler start -e cpu --jfrsync +jdk.YoungGarbageCollection+jdk.OldGarbageCollection -f combined.jfr
Notes
- When specifying a list of events, events are separated by a plus sign + because commas , are used to separate different options.
- If the --jfrsync parameter does not start with +, it is treated as a preset profile name or a path to a .jfc configuration file.
- Directly specifying a list of events is particularly useful when the target application is running in a container, without additional file operations.
Run profiler in a loop
Use --loop TIME to run profiler in a loop (continuous profiling). The argument is either a clock time (hh:mm:ss) or a loop duration in seconds, minutes, hours, or days. Make sure the filename includes a timestamp pattern, or the output will be overwritten on each iteration. The command below will run profiling endlessly and save records of each hour to a jfr file.
If the
-fparameter is not specified, nothing will be saved. If the-fparameter does not contain%t, it will overwrite the same file repeatedly.
profiler start --loop 1h -f /var/log/profile-%t.jfr
--timeout option
profiler start --timeout 300s
This option specifies the time when profiling will automatically stop. The format is the same as in loop: it is either a wall clock time (12:34:56) or a relative time interval (2h).
Both --loop and --timeout are used for start action, for further information refer to async-profiler docs.
--wall option
The -- wall option allows for simultaneous performance analysis of both CPU and Wall Clock. This joint analysis helps to more comprehensively identify and understand performance bottlenecks in applications. --The wall option allows users to set the sampling interval for Wall Clock analysis independently of CPU analysis. For example, by setting - e cpu-i 10-- wall 200, the CPU sampling interval can be set to 10 milliseconds, and the wall clock sampling interval can be set to 200 milliseconds. When conducting joint CPU and Wall Clock analysis, the output format must be set to jfr. This format supports recording the state information of threads (such as State_SUNNABLE or State_SLEEPING) to distinguish between different types of sampling events.
influence Linux platform: This new feature is only available on the Linux platform. The CPU analysis engine on macOS is already based on Wall clock mode, so there are no additional benefits. Performance overhead: Enabling Wall clock analysis will increase performance overhead, so when analyzing both CPU and Wall clock simultaneously, it is recommended to increase the interval between Wall clocks.
profiler start -e cpu -i 10 --wall 100 -f out.jfr
ctimer events
ctimer events are a new CPU sampling mode based on timer_create, providing accurate CPU sampling without perf_events.
In some cases, perf_events may not be available, for example due to perf_event_paranoid settings or seccomp restrictions, or in container environments. Although itimer events can work in containers, there may be sampling inaccuracies.
ctimer events combine the advantages of cpu and itimer:
High accuracy: provides accurate CPU sampling.
Container-friendly: available in containers by default.
Low resource consumption: does not consume file descriptors.
**Note that ctimer events are currently only supported on Linux, not macOS. ** See async-profiler Github Issues for more information.
Example:
profiler start -e ctimer -o jfr -f ./out-test.jfr
vtable Feature
In some applications, a lot of CPU time is spent in calling megamorphic virtual or interface methods, which is shown as vtable stub or itable stub in performance analysis. This does not help us understand why a specific call site is megamorphic and how to optimize it.
The vtable feature can add a pseudo frame on top of the vtable stub or itable stub, showing the actual object type being called. This helps to clearly understand the ratio of different receivers at a specific call site.
This feature is disabled by default and can be enabled with the -F vtable option (or using features=vtable). See the async-profiler Github Issues for more information.
Example:
profiler start -F vtable
comptask feature
profiler samples the JIT compiler threads as well as the Java threads, and can show the percentage of CPU consumed by JIT compilation. However, the compilation resource consumption of Java methods varies, and it is useful to know which specific Java methods consume the most CPU time when compiling.
The comptask feature adds a virtual frame to the stack trace of C1/C2, showing the current task being compiled, that is, the Java method being compiled.
This feature is disabled by default and can be enabled with the -F comptask option (or using features=comptask). See async-profiler Github Issues for more information.
Example:
profiler start -F comptask
Configuring Alternative Profiling Signals
profiler uses POSIX signals for performance profiling. By default, SIGPROF is used for CPU profiling and SIGVTALRM is used for Wall-Clock profiling. However, this can lead to signal conflicts if your application also uses these signals or if you want to run multiple profiler instances simultaneously.
You can now use the signal parameter to configure the signal used for profiling to avoid conflicts.
See async-profiler Github Issues for more information.
Syntax
profiler start --signal <signal number>
If you need to specify the signal for CPU and Wall-Clock analysis separately, you can use the following syntax:
profiler start --signal <CPU signal number>/<Wall signal number>
--clock option
The --clock option allows the user to control the clock source used for sampling timestamps. This is useful for scenarios where you need to align the timestamps of profiler data with data from other tools.
Usage
profiler start --clock <tsc|monotonic>
Parameters
tsc: Use the CPU's timestamp counter (RDTSC). This is the default option and provides high-precision timestamps.monotonic: Use the operating system's monotonic clock (CLOCK_MONOTONIC). This helps align timestamps between multiple data sources. See async-profiler Github Issues for more information.
Example:
Using CLOCK_MONOTONIC as timestamp source:
profiler start --clock monotonic
Notes:
Use
--clock monotonicwhen you need to alignprofilerdata with data from other tools that useCLOCK_MONOTONIC(e.g.perf).Use
--clockoption with caution when usingjfrsyncmode, as the JVM andprofilermay use different timestamp sources, which may lead to inconsistent results.
--norm option
In Java 20 and earlier, the method names generated by the compiler for lambda expressions contain a unique numeric suffix. For example, a lambda expression defined in the same code location may generate multiple different frame names, because each lambda method name is appended with a unique numeric suffix (such as lambda$method$0, lambda$method$1, etc.). This causes logically identical stacks to not be merged in the flame graph, increasing the complexity of performance analysis.
To solve this problem, profiler has added a --norm option that automatically normalizes method names when generating output, removes these numeric suffixes, and enables identical stacks to be merged correctly. Please refer to async-profiler Github Issues for more information.
Example:
Generate a normalized flame graph:
profiler start --norm