Table of Contents
# dashboard
dashboard online tutorialopen in new window
TIP
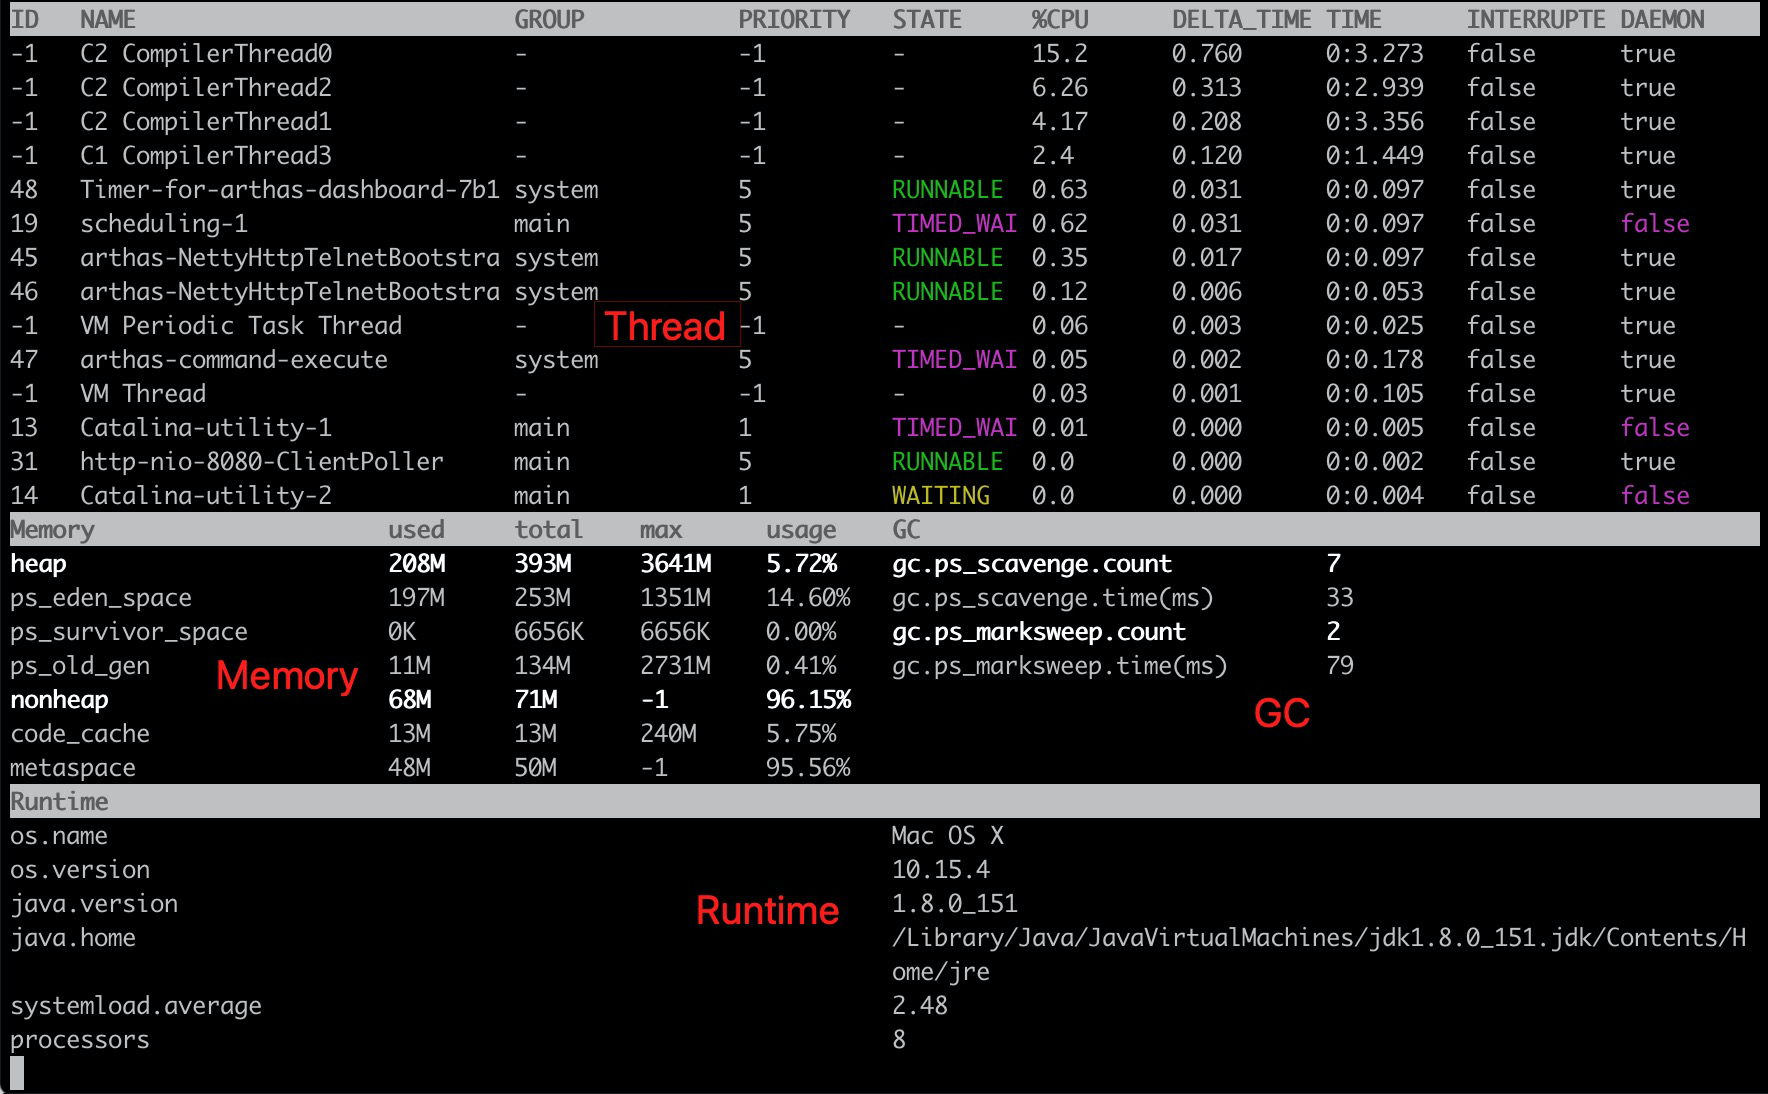
This is the real time statistics dashboard for the current system, press Ctrl+C to exit.
When running in Apache Tomcat Alibaba edition, the dashboard will also present the real time statistics of the tomcat, including QPSopen in new window, RT, error counts, and thread pool, etc.
# Options
| Name | Specification |
|---|---|
| [i:] | The interval (in ms) between two executions, default is 5000 ms. |
| [n:] | The number of times this command will be executed. |
# Usage
$ dashboard
ID   NAME                           GROUP           PRIORITY   STATE     %CPU      DELTA_TIME TIME      INTERRUPTE DAEMON
-1   C2 CompilerThread0             -               -1         -         1.55      0.077      0:8.684   false      true
53   Timer-for-arthas-dashboard-07b system          5          RUNNABLE  0.08      0.004      0:0.004   false      true
22   scheduling-1                   main            5          TIMED_WAI 0.06      0.003      0:0.287   false      false
-1   C1 CompilerThread0             -               -1         -         0.06      0.003      0:2.171   false      true
-1   VM Periodic Task Thread        -               -1         -         0.03      0.001      0:0.092   false      true
49   arthas-NettyHttpTelnetBootstra system          5          RUNNABLE  0.02      0.001      0:0.156   false      true
16   Catalina-utility-1             main            1          TIMED_WAI 0.0       0.000      0:0.029   false      false
-1   G1 Young RemSet Sampling       -               -1         -         0.0       0.000      0:0.019   false      true
17   Catalina-utility-2             main            1          WAITING   0.0       0.000      0:0.025   false      false
34   http-nio-8080-ClientPoller     main            5          RUNNABLE  0.0       0.000      0:0.016   false      true
23   http-nio-8080-BlockPoller      main            5          RUNNABLE  0.0       0.000      0:0.011   false      true
-1   VM Thread                      -               -1         -         0.0       0.000      0:0.032   false      true
-1   Service Thread                 -               -1         -         0.0       0.000      0:0.006   false      true
-1   GC Thread#5                    -               -1         -         0.0       0.000      0:0.043   false      true
Memory                     used     total    max      usage    GC
heap                       36M      70M      4096M    0.90%    gc.g1_young_generation.count   12
g1_eden_space              6M       18M      -1       33.33%                                  86
g1_old_gen                 30M      50M      4096M    0.74%    gc.g1_old_generation.count     0
g1_survivor_space          491K     2048K    -1       24.01%   gc.g1_old_generation.time(ms)  0
nonheap                    66M      69M      -1       96.56%
codeheap_'non-nmethods'    1M       2M       5M       22.39%
metaspace                  46M      47M      -1       98.01%
Runtime
os.name                                                        Mac OS X
os.version                                                     10.15.4
java.version                                                   15
java.home                                                      /Library/Java/JavaVirtualMachines/jdk-15.jdk/Contents/Home
systemload.average                                             10.68
processors                                                     8
uptime                                                         272s
# Notes on column headers
- ID: JVM thread ID, pls. note this ID is different from the nativeID in jstack
- NAME: thread name
- GROUP: thread group name
- PRIORITY: thread priority, ranged from 1 to 10. The greater number, the higher priority
- STATE: thread state
- CPU%: the ratio of CPU usage for the thread. For example, the sampling interval is 1000ms, and the incremental cpu time of a thread is 100ms, then the cpu usage rate=100/1000=10%
- DELTA_TIME: incremental CPU time of thread running after the last sampling in
secondformat - TIME: total CPU time of the thread in
minute:secondformat - INTERRUPTED: the thread interruption state
- DAEMON: daemon thread or not
# JVM internal threads
After Java 8, it is supported to obtain the CPU time of JVM internal threads. These threads only have the name and CPU time, without ID and status information (display ID is -1).
JVM activities can be observed through internal threads, such as GC, JIT compilation, etc., to perceive the overall status of JVM.
- When the JVM heap/metaspace space is insufficient or OOM, it can be seen that the CPU usage of the GC threads is significantly higher than other threads.
- After executing commands such as
trace/watch/tt/redefine, you can see that JIT threads activities become more frequent. Because the JIT compilation data related to this class is cleared when the JVM hot update the class bytecode, it needs to be recompiled.
JVM internal threads include the following:
- JIT compilation thread: such as
C1 CompilerThread0,C2 CompilerThread0 - GC thread: such as
GC Thread0,G1 Young RemSet Sampling - Other internal threads: such as
VM Periodic Task Thread,VM Thread,Service Thread
# Screenshot
